Application observability

Traces, users and logs — on your servers.

Instrument services with OpenTelemetry and see every request across your stack. Add real user monitoring and session replay for the browser, SDKs for mobile apps, and fast log search — without per-GB ingest pricing.

Answer

Kllyroo APM ingests OpenTelemetry traces to build service maps, latency and error views, SLOs with error budgets and burn alerts, continuous profiling flame graphs and an errors inbox. RUM captures Web Vitals and masked session replays; mobile SDKs cover Android, iOS, React Native and Flutter; logs support search, live tail, pipelines and storage tiers.

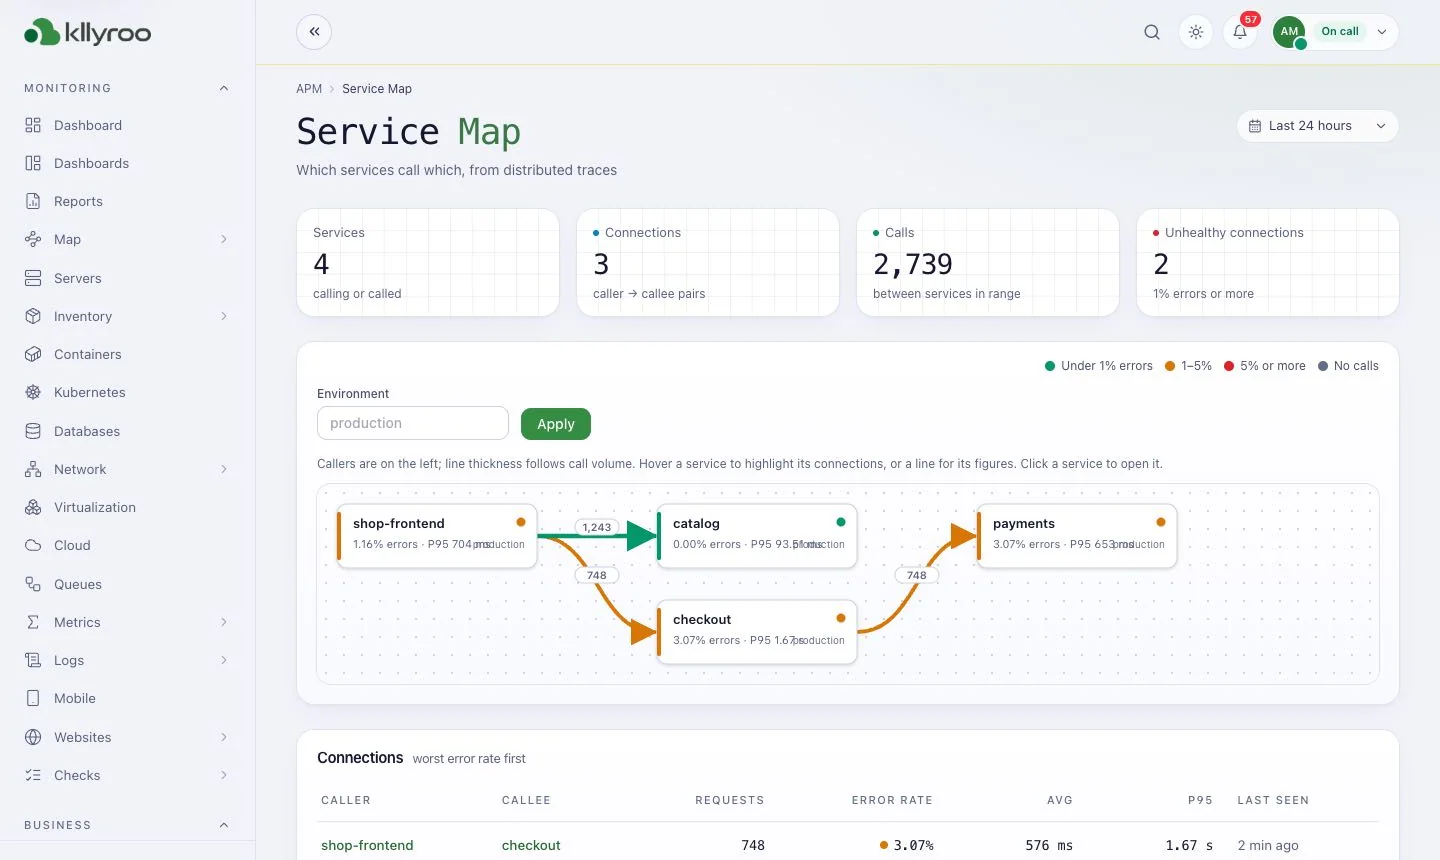
kllyroo.your-company.local/apm/service-map
Kllyroo APM service map built from distributed traces with error rate and latency per call
Service map with error rate and latency on every connection
Capabilities

What you get

APM services & traces

OpenTelemetry services, distributed traces and an automatic service map.

SLOs & error budgets

Define objectives, track error budgets and get burn-rate alerts before users notice.

Continuous profiling

Flame graphs, diffs and regression detection to find the code that got slow.

Real user monitoring

Web Vitals, pages, API calls and masked session replays of real visitors.

Mobile & LLM monitoring

Crashes, ANRs and symbols for mobile apps; tokens, cost, latency and quality of LLM calls.

Logs

Log explorer, live tail, pipelines and storage tiers — measured at ~14,000 lines/s end-to-end ingest.

Logs

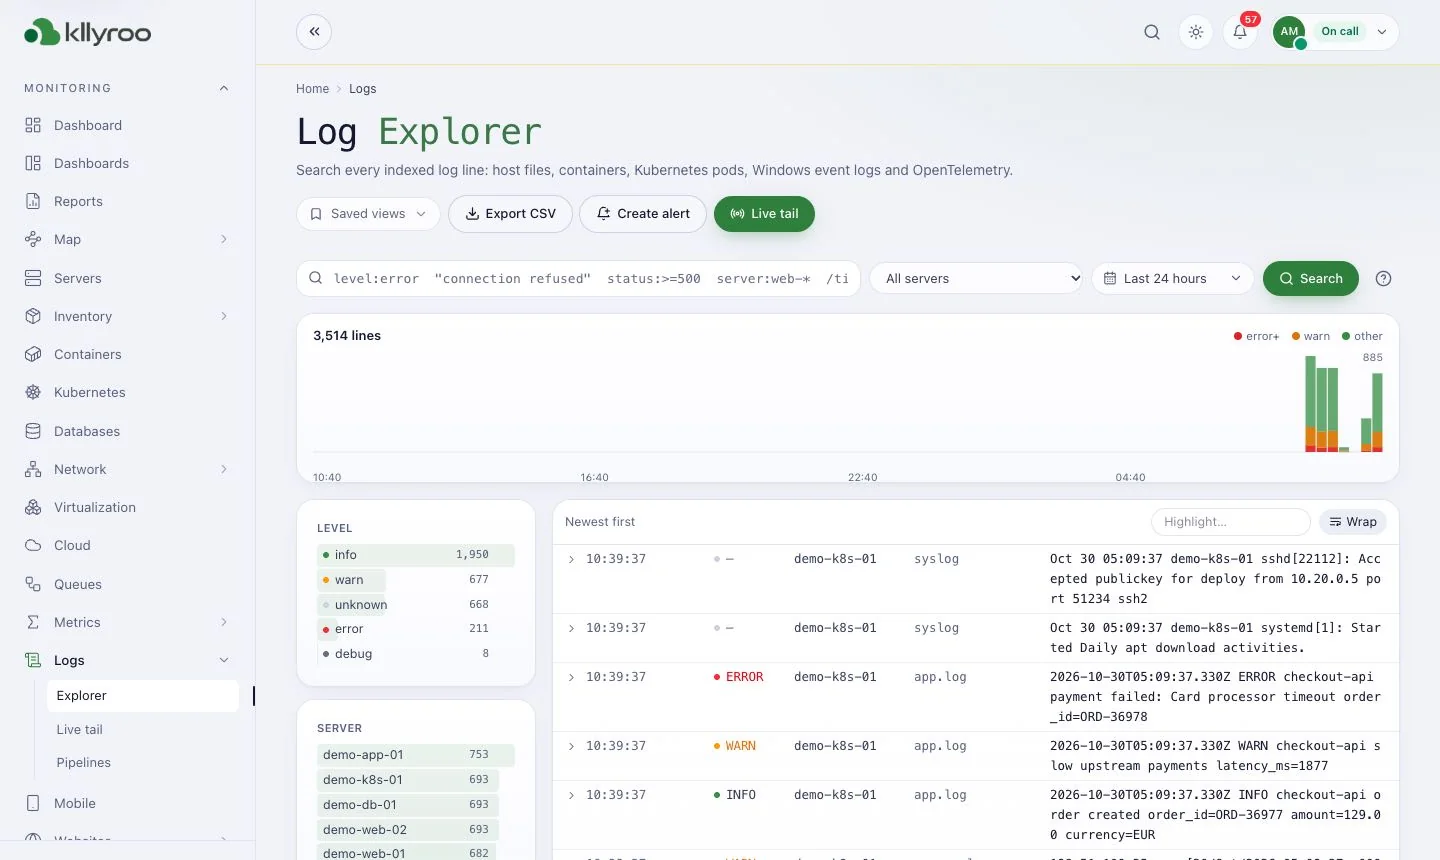
Search millions of lines — no ingest bill

Logs land on your own storage, so a noisy week never turns into a surprise invoice. The AI engine learns normal log volume and flags error bursts automatically.
  • Live tail and saved views
  • Pipelines to parse and enrich
  • Storage tiers and retention you control
  • Business journeys: UPI / payment / order KPIs from real transactions
kllyroo.your-company.local/logs
Kllyroo Log Explorer with filters, volume histogram and log lines from servers, containers and OpenTelemetry
Product screens

More screens from the Kllyroo portal

Real screenshots from the Kllyroo user guide (demo data). Click any image to enlarge.
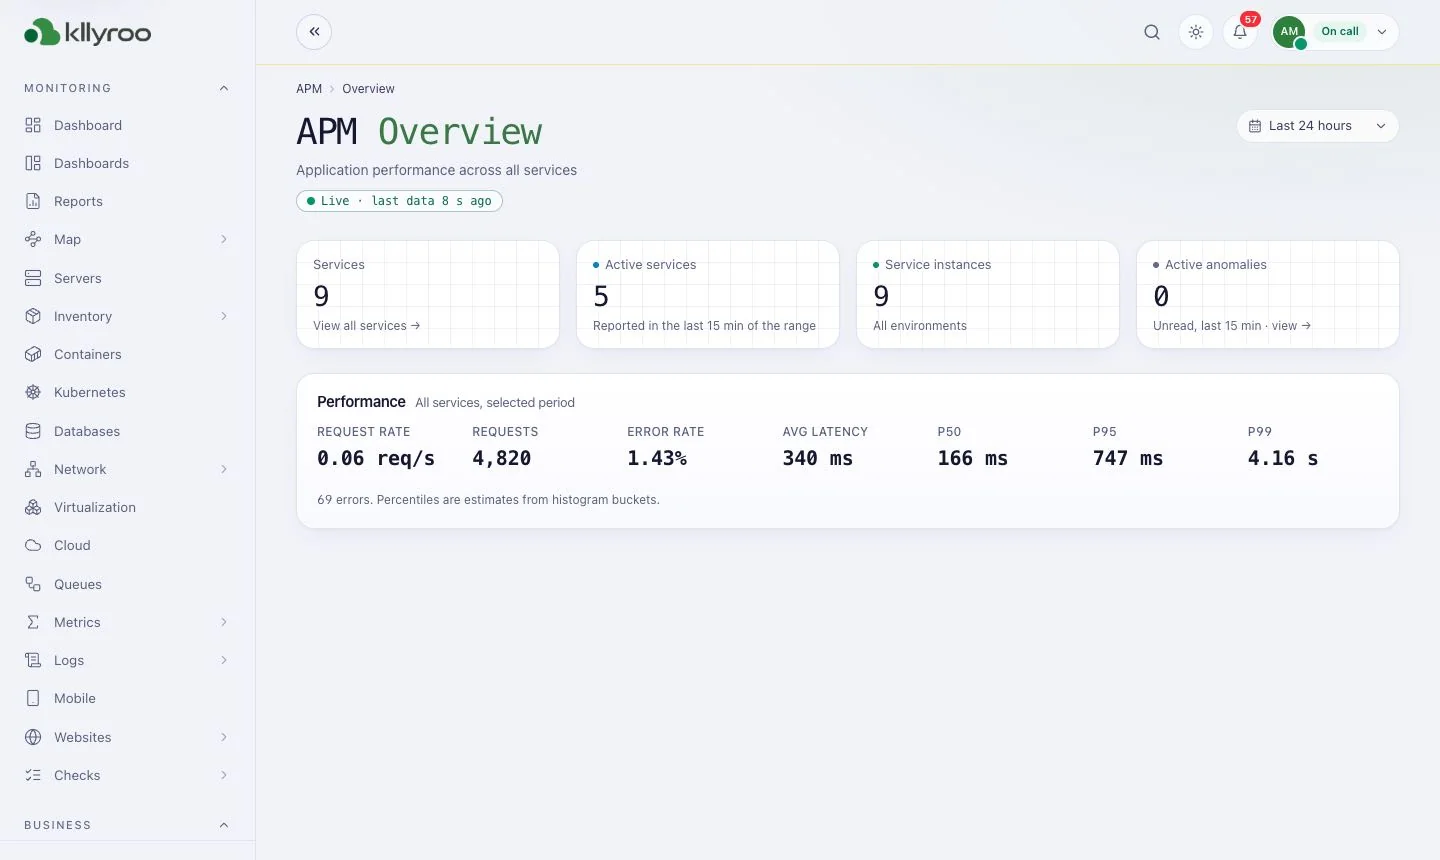
kllyroo.your-company.local
Kllyroo APM overview screen: Request rate, errors and latency across services.
APM overview

Request rate, errors and latency across services.

kllyroo.your-company.local
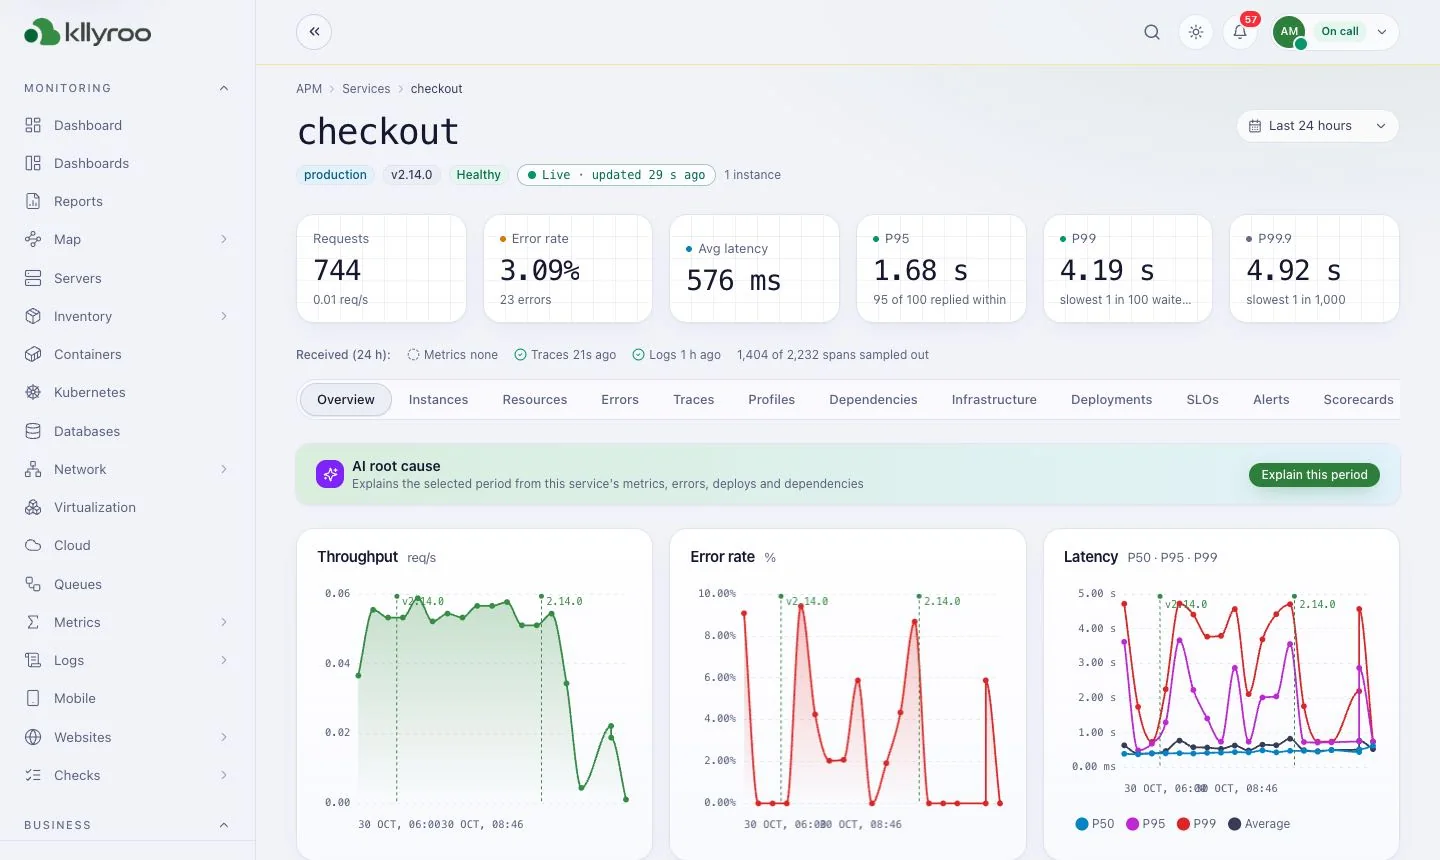
Kllyroo Service detail screen: Throughput, error rate and latency for one service.
Service detail

Throughput, error rate and latency for one service.

kllyroo.your-company.local
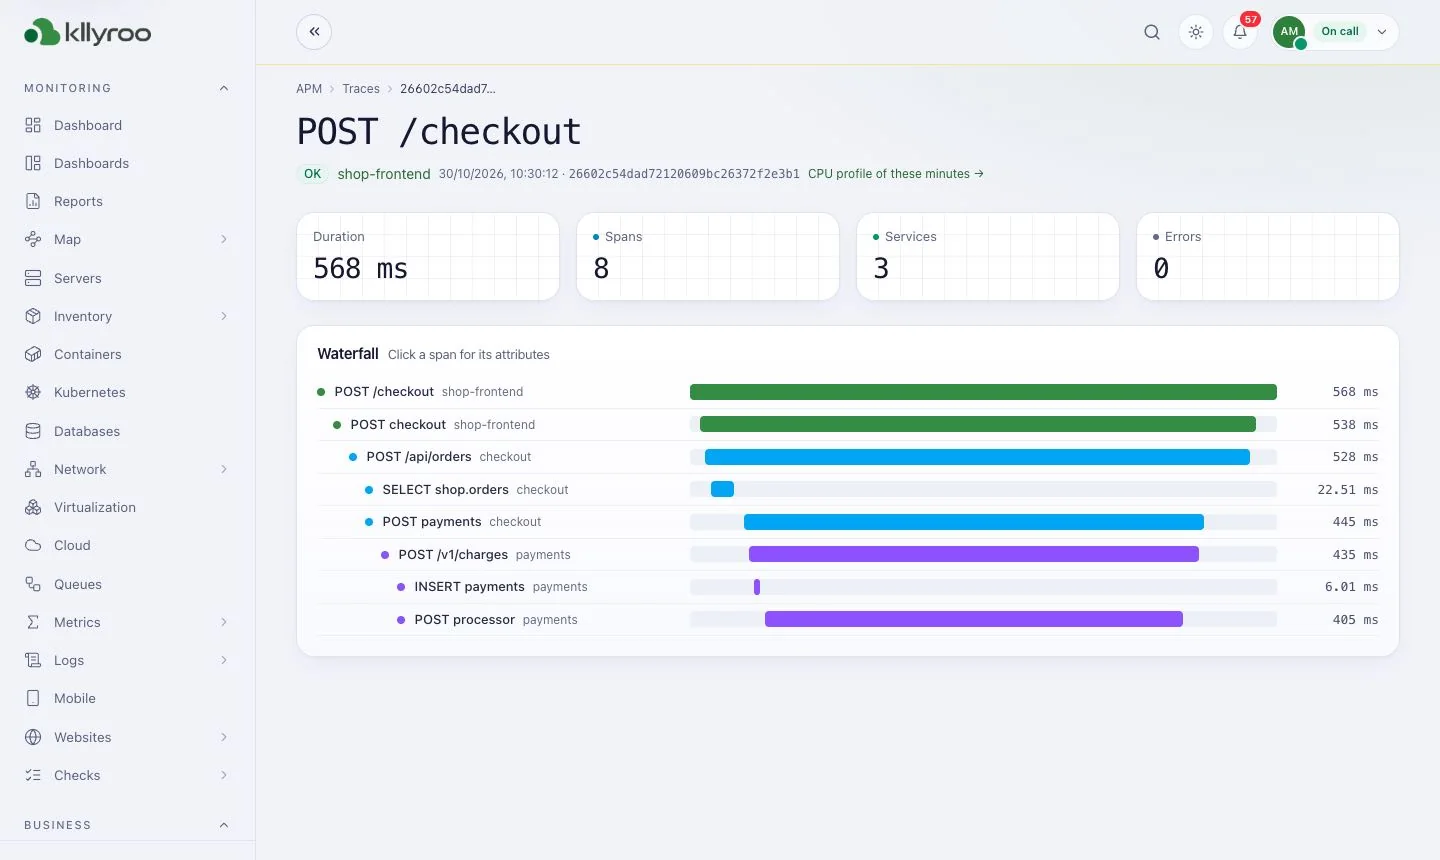
Kllyroo Distributed trace screen: Span waterfall for a single request.

Distributed trace

Span waterfall for a single request.

kllyroo.your-company.local
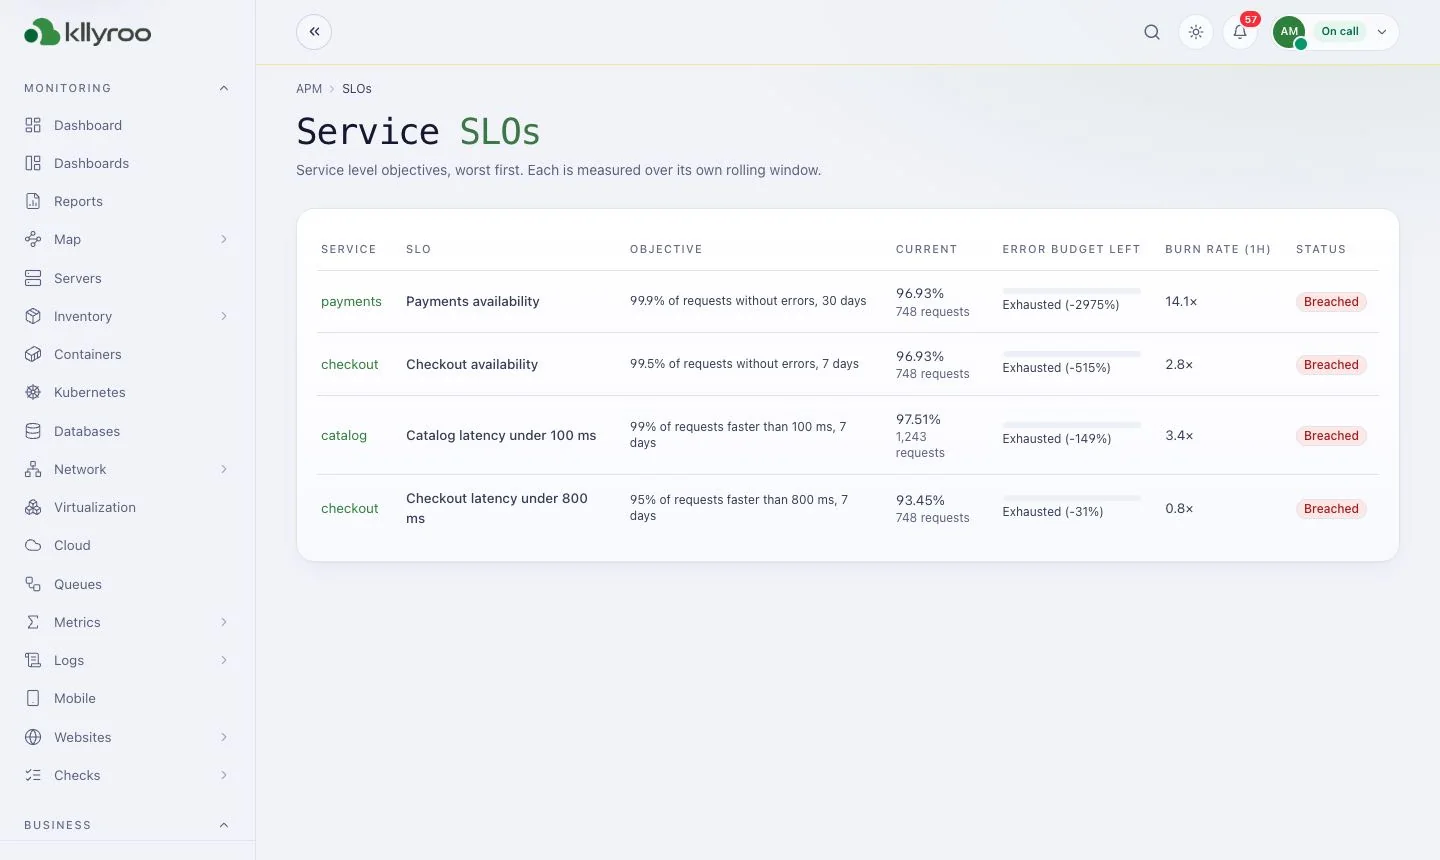
Kllyroo SLOs screen: Each service against its target, with error budget.
SLOs

Each service against its target, with error budget.

kllyroo.your-company.local
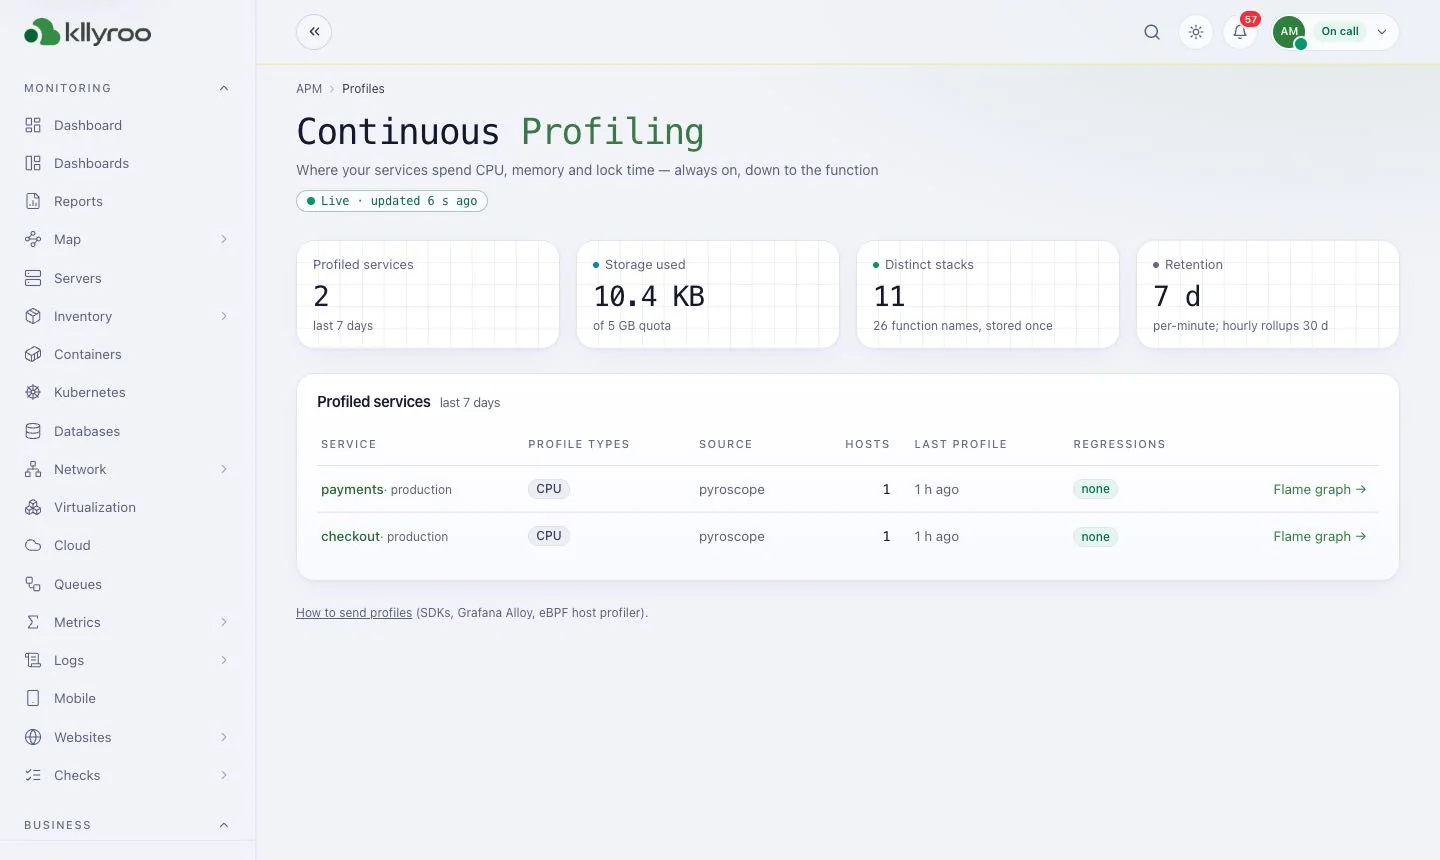
Kllyroo Continuous profiling screen: Where services spend CPU, memory and lock time.
Continuous profiling

Where services spend CPU, memory and lock time.

kllyroo.your-company.local
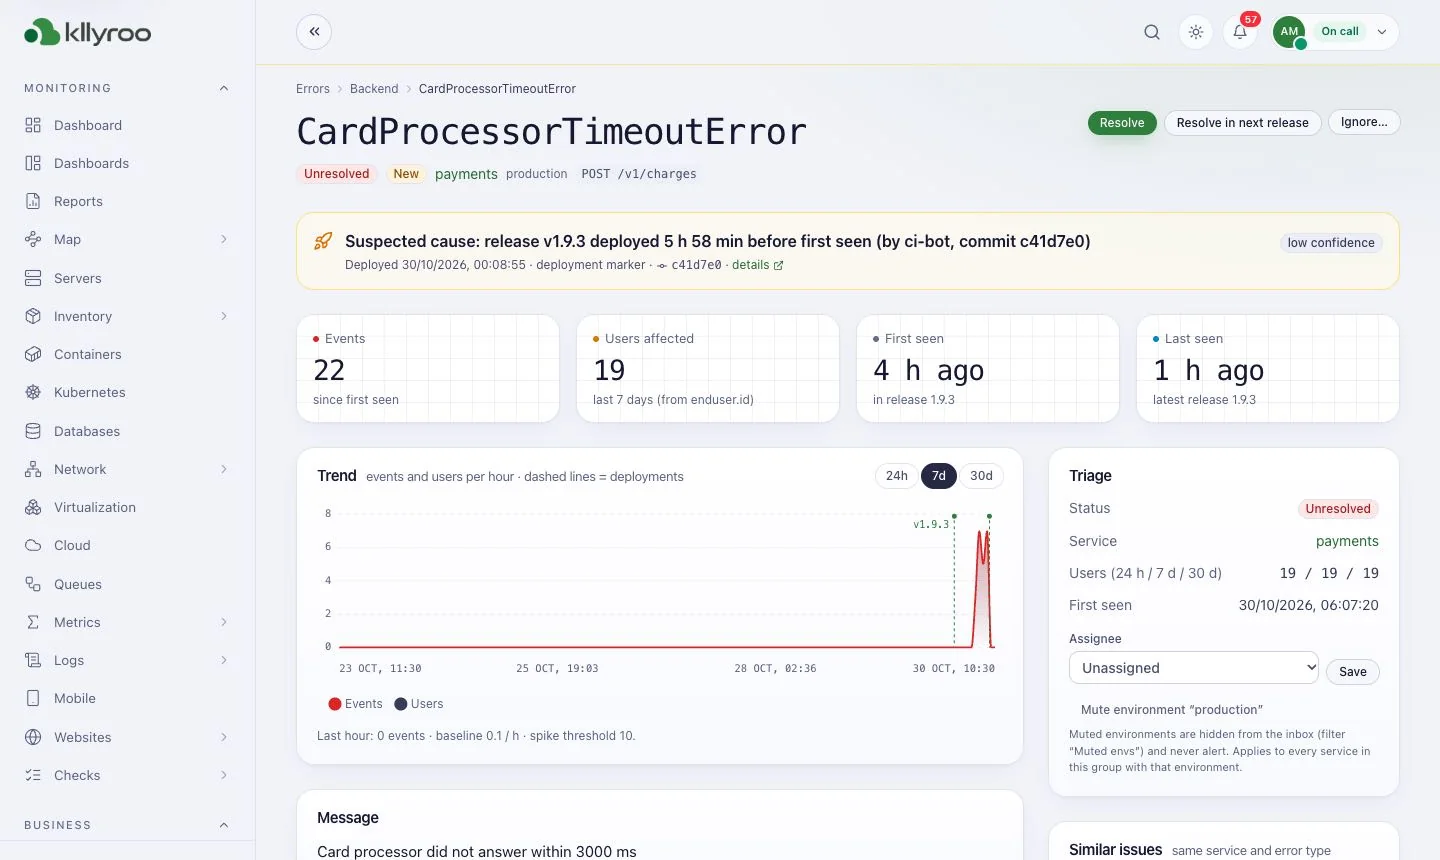
Kllyroo Errors inbox screen: Backend, browser and mobile errors grouped into issues.
Errors inbox

Backend, browser and mobile errors grouped into issues.

kllyroo.your-company.local
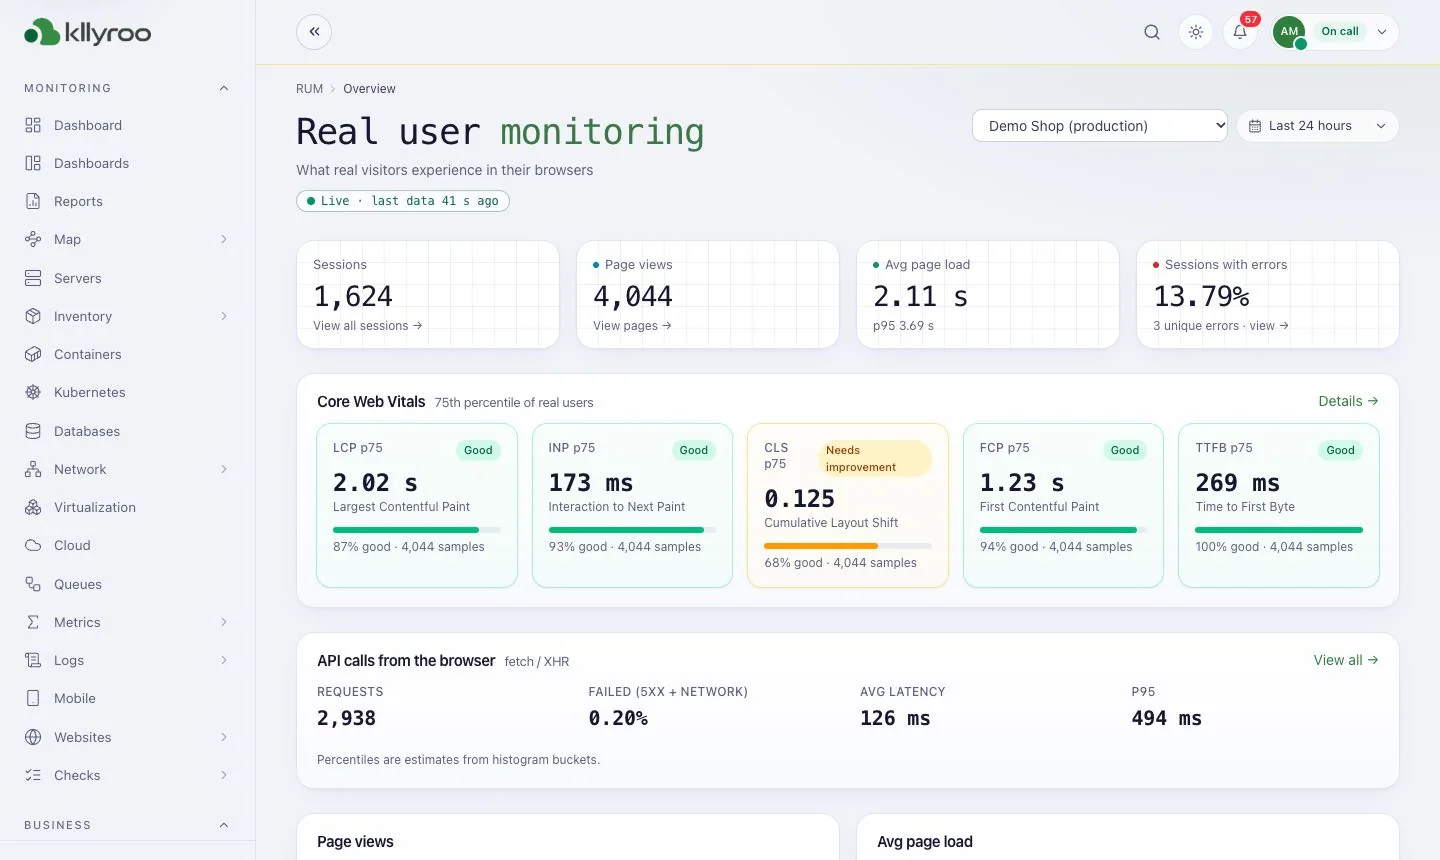
Kllyroo Real user monitoring screen: Page loads, Core Web Vitals and API calls from real visitors.
Real user monitoring

Page loads, Core Web Vitals and API calls from real visitors.

kllyroo.your-company.local
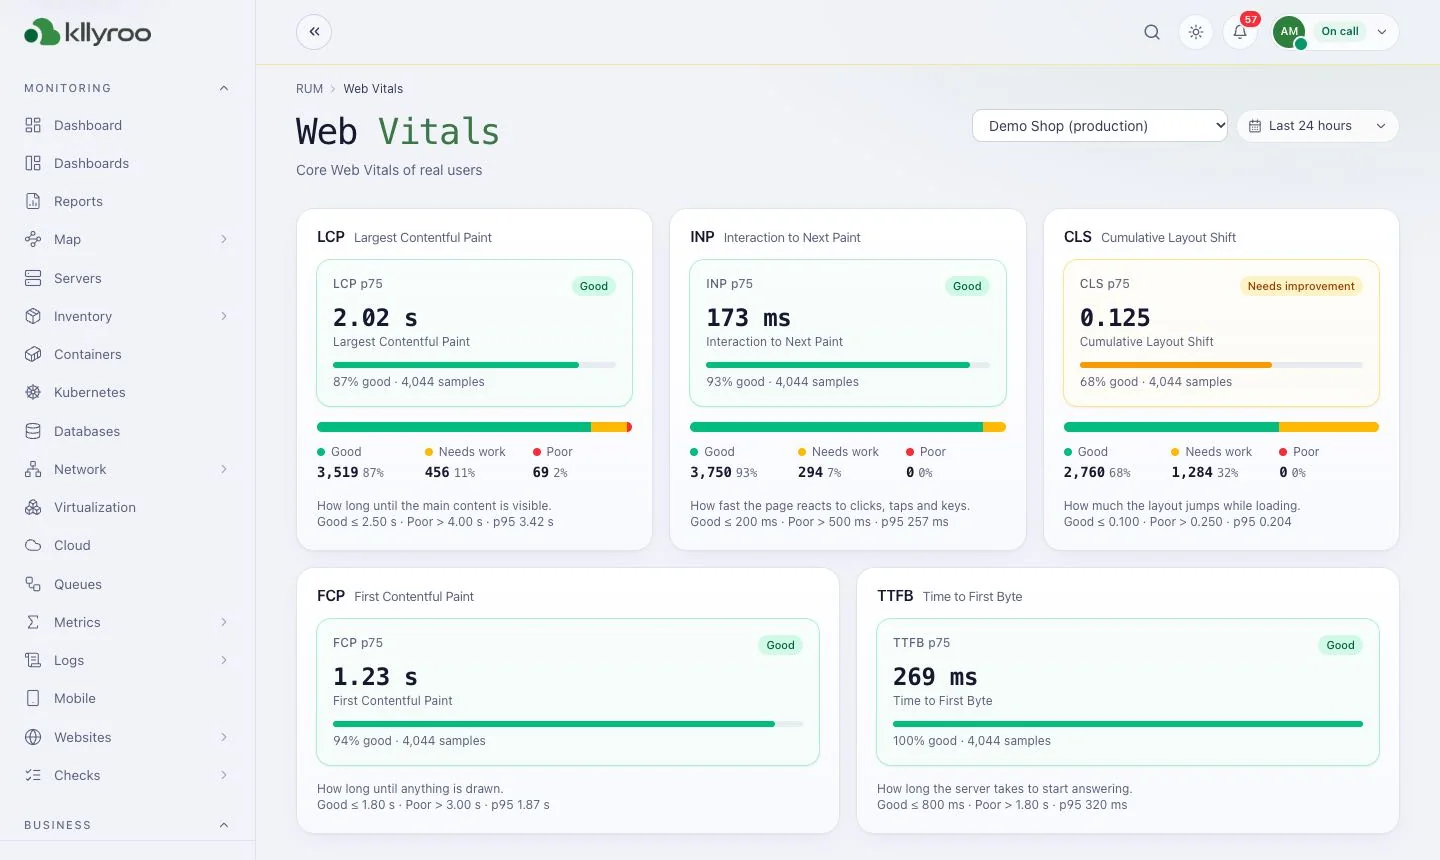
Kllyroo Web Vitals screen: LCP, INP, CLS and more at the 75th percentile.
Web Vitals

LCP, INP, CLS and more at the 75th percentile.

kllyroo.your-company.local
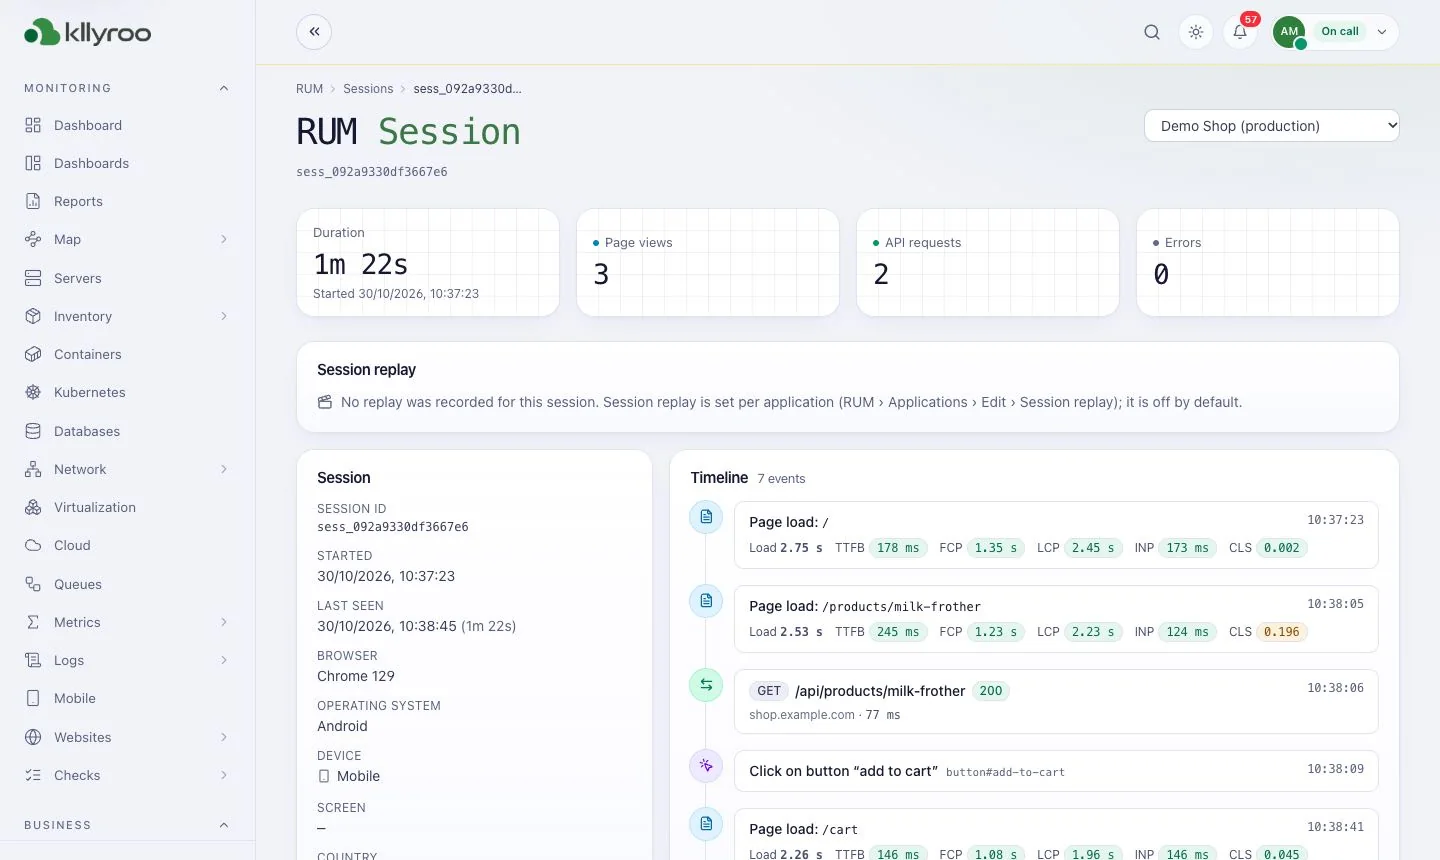
Kllyroo Session replay screen: A single visit with replay and timeline.
Session replay

A single visit with replay and timeline.

kllyroo.your-company.local
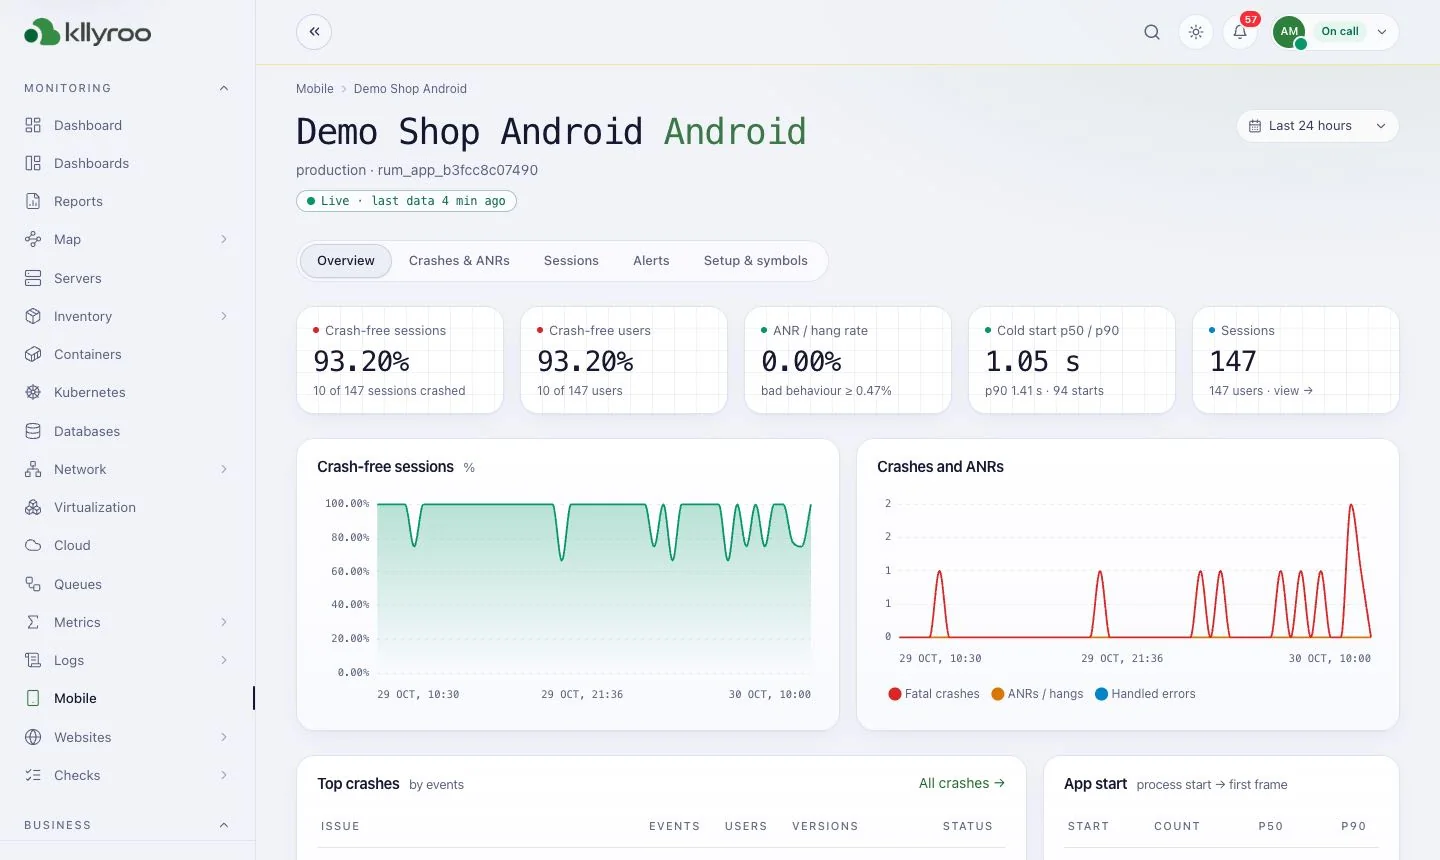
Kllyroo Mobile apps screen: Crash-free sessions, crashes and ANRs.
Mobile apps

Crash-free sessions, crashes and ANRs.

kllyroo.your-company.local
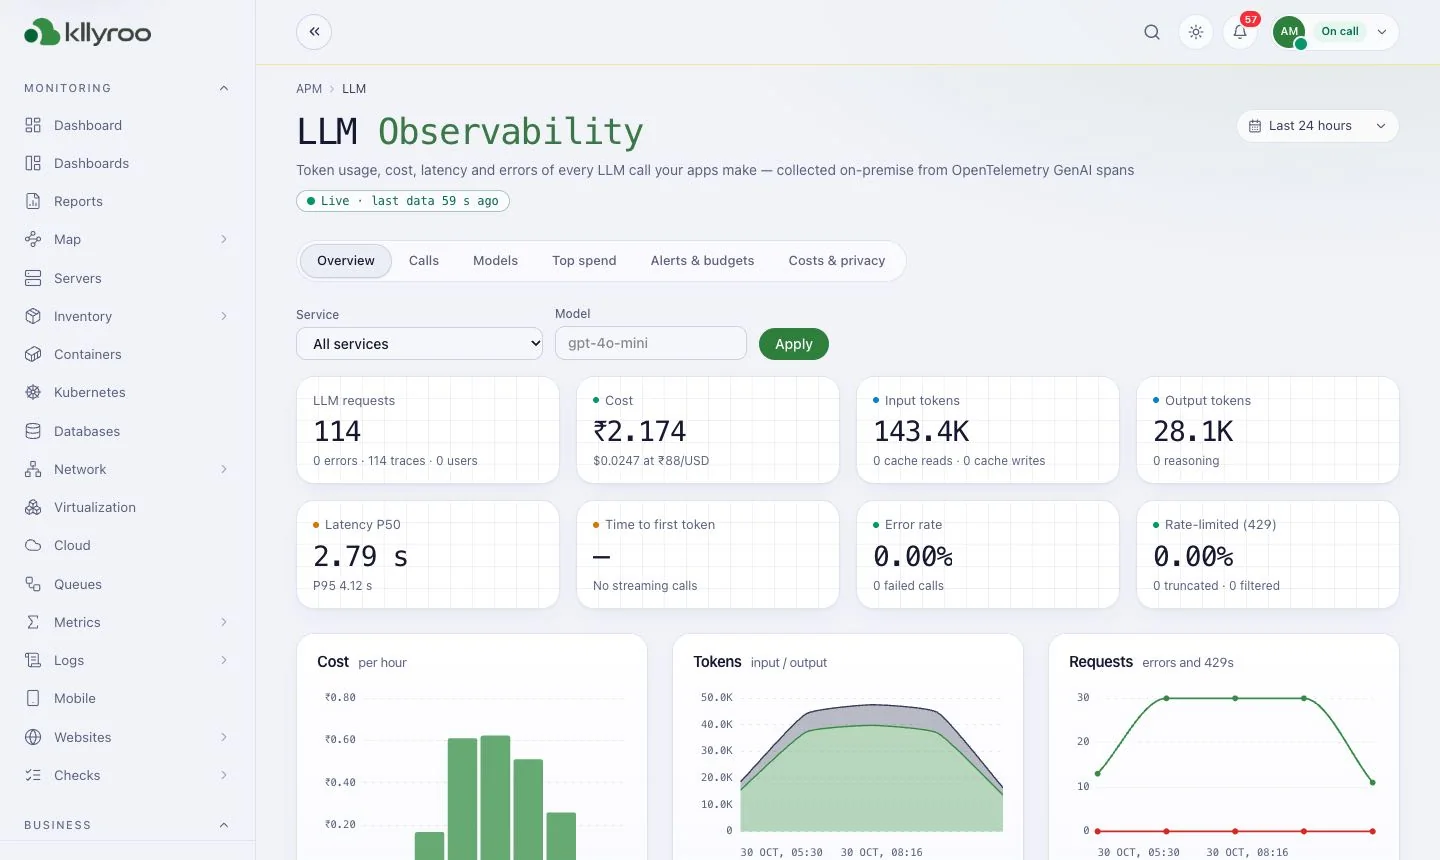
Kllyroo LLM observability screen: Tokens, cost, latency and errors of LLM calls.
LLM observability

Tokens, cost, latency and errors of LLM calls.

kllyroo.your-company.local
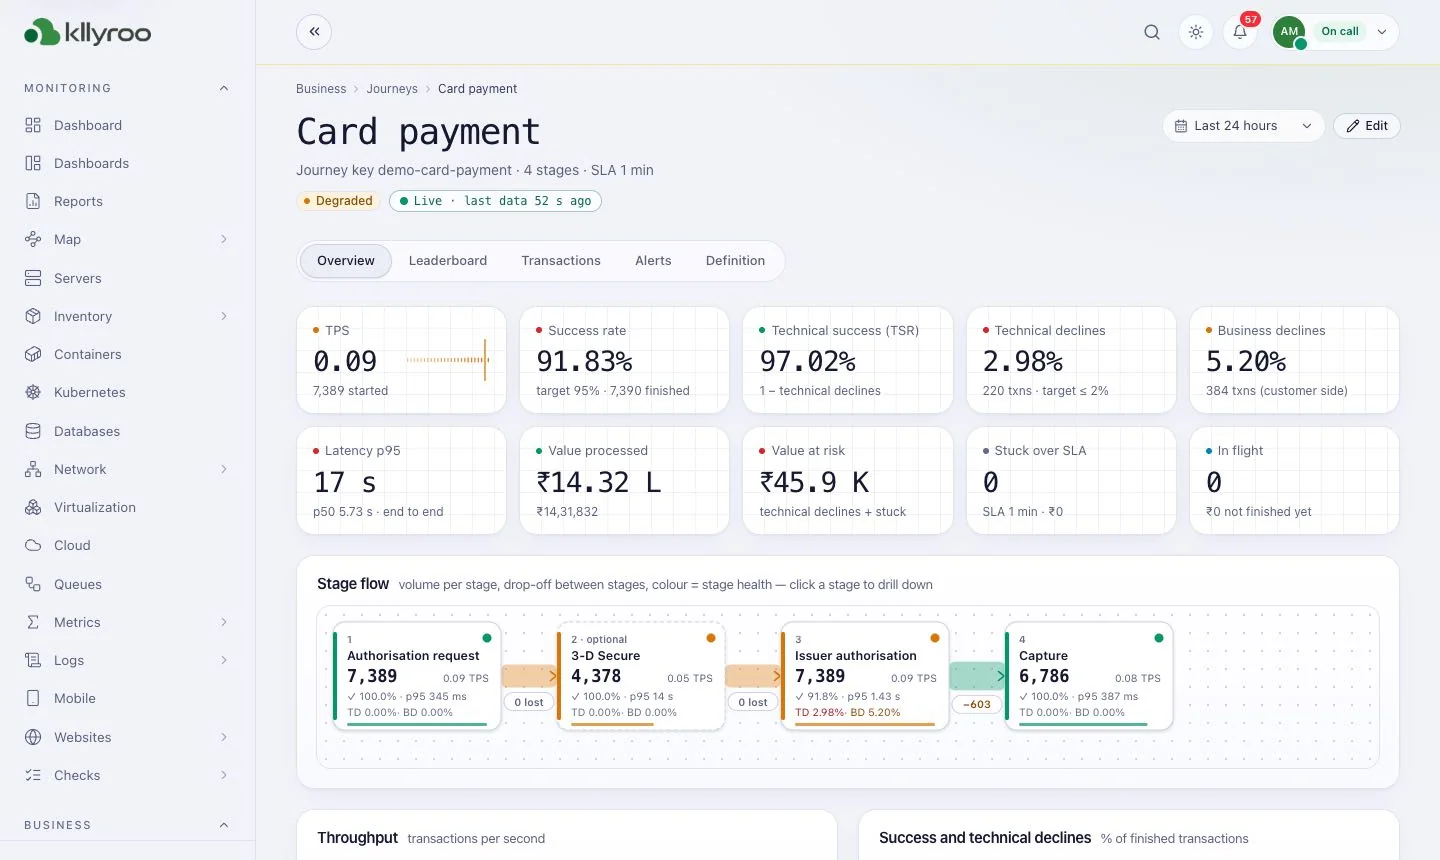
Kllyroo Business journeys screen: Stage flow and drop-off for real payment transactions.
Business journeys

Stage flow and drop-off for real payment transactions.

kllyroo.your-company.local
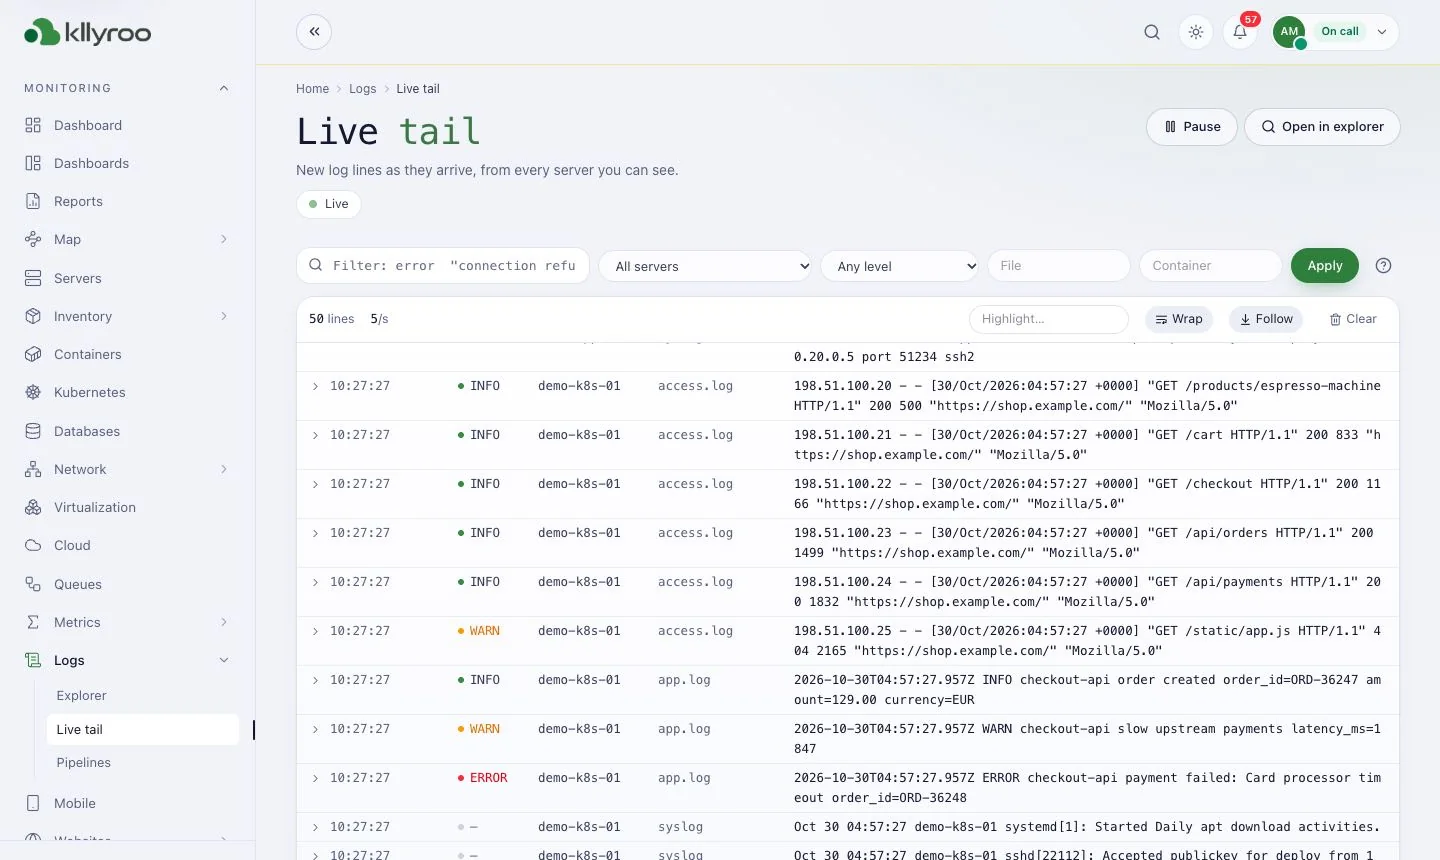
Kllyroo Live tail screen: New log lines from all servers as they arrive.
Live tail

New log lines from all servers as they arrive.

kllyroo.your-company.local
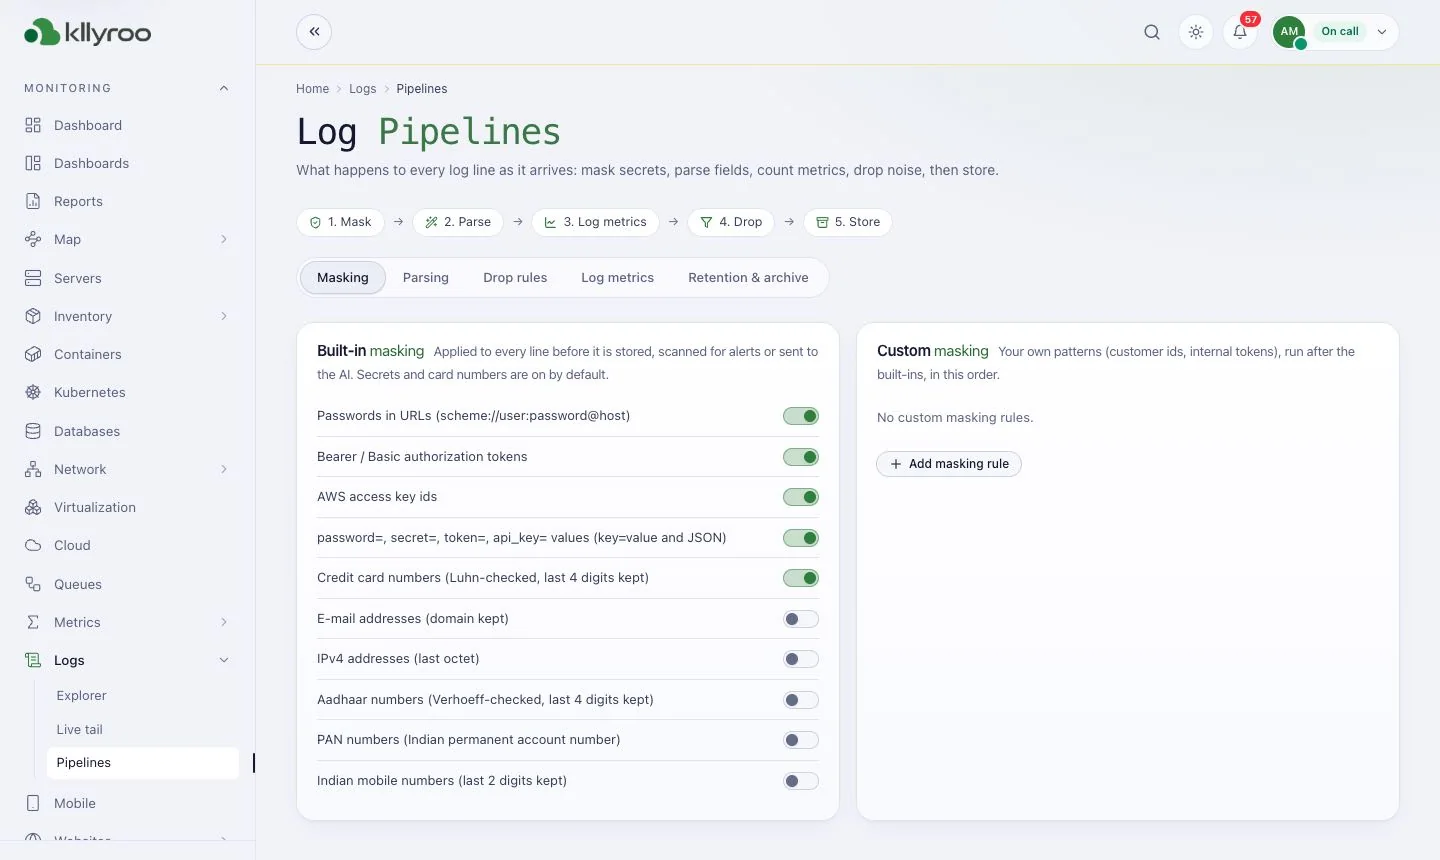
Kllyroo Log pipelines screen: Processing steps with built-in and custom masking.

Log pipelines

Processing steps with built-in and custom masking.

FAQ

Frequently asked questions

Does Kllyroo support OpenTelemetry?

Yes. Kllyroo APM receives OpenTelemetry traces from your services, so you can use standard OpenTelemetry SDKs and collectors.

Is session replay privacy-safe?

Session replays are masked and stored on your own Kllyroo server, together with all other RUM data.

Can Kllyroo monitor LLM and AI applications?

Yes. The LLM monitoring module tracks tokens, cost, latency and quality of LLM calls made by your applications.

Next step

See Kllyroo on your own infrastructure

Get a guided walkthrough, sizing advice for your estate, and a licence quote. Kllyroo installs on your server in under an hour and runs fully offline.